Step 1: Business Understanding
The purpose of this section is to define the business problem and understand the stakeholders for the work that I am performing. Mount Sinai is a hospital network in New York City. The Health System includes more than 6,600 primary and specialty care physicians and 13 ambulatory surgical centers.
For years, doctors at Mount Sinai review chest x-rays and try to determine whether there a patient has pneumonia. Pneumonia is an infection of the lung. The lungs fill with fluid and make breathing difficult. Pneumonia disproportionately affects the young, the elderly, and the immunocompromised. It preys on weakness and vulnerability.
According to a 2010 study performed by the Henry Ford Health System, Pneumonia ranks second to congestive heart failure as the reason for readmission within 30 days of a previous hospitalization. Here are some important findings from the study:
72 percent of patients were misdiagnosed with pneumonia upon readmission to the same hospital. African-Americans were twice more likely than Caucasians to be misdiagnosed with pneumonia. Patients who smoke or have lung disease were likely to be misdiagnosed with pneumonia. 72 percent of the misdiagnoses occurred in the Emergency Department. Fewer than 33 percent of patients had any outpatient follow-up care prior to their readmission. With these statistics in mind, Mount Sinai has contracted me to use deep learning to more accurately predict whether a patient has pneumonia, given a patient’s chest x-ray.
The stakeholders of this project are patients, doctors, and radiologists.
The main purpose of this classification model is predictive, meaning that given a picture of a patients chest, the model should be able to predict whether that patient has pneumonia or not.
Step 2: Data Understanding
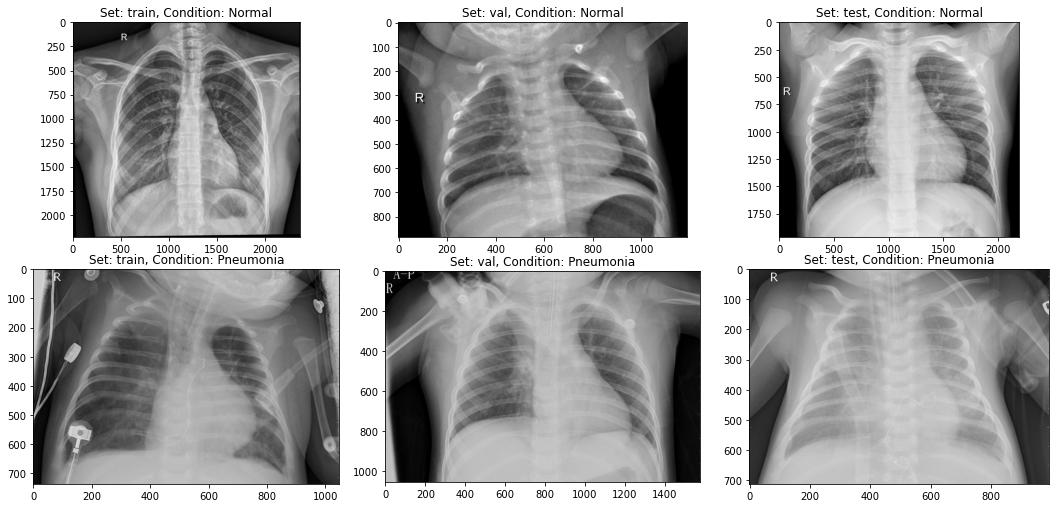
As we can see above, it is hard to differentiate a normal x-ray and a pneumonia x-ray. It makes sense that pneumonia is a large cause of patient readmission. Our model should be able to help us with classification.

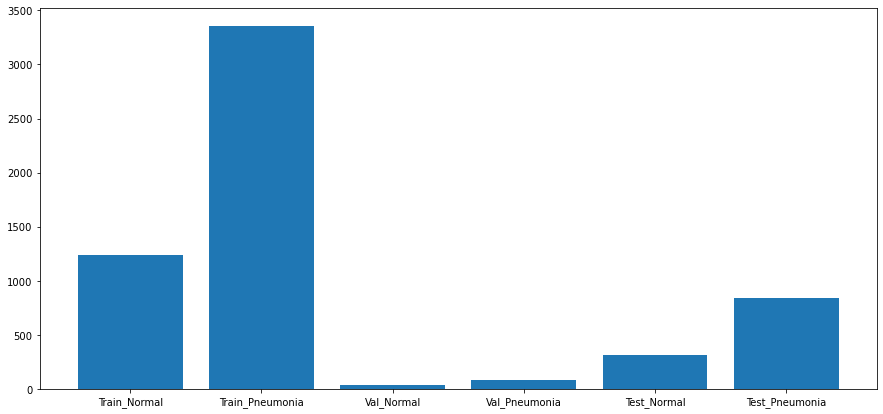
See below some metrics on how our population is broken out:
train/NORMAL: 1240 train/PNEUMONIA: 3351 val/NORMAL: 34 val/PNEUMONIA: 85 test/NORMAL: 309 test/PNEUMONIA: 837
Value Counts: Normal: 0.2703210382513661 Pneumonia: 0.7296789617486339
Population Breakdown: Train: 0.7839822404371585 Test: 0.19569672131147542 Val: 0.02032103825136612
Sum: 5856
Step 3: Data Preparation
Before modeling, I create an X and Y array to prep my train data for KFold Cross Validation. Then I convert our images to an array using the ImageDataGenerator. I separate the images into image arrays and image labels. The image arrays contain the picture data, and the image labels contain the classifiers. After that, I reshape the arrays and label them as our train, test, and validation datasets.
Step 4: Modeling
First step in the modeling process is to create a simple baseline model in Keras. My model has an input layer, a hidden layer, and an output layer. I train it through 50 epochs, and validate using my test images (my validation data will be used as the holdout set for my final model). The train and test accuracys was .931 and .926, respectively.
The next model uses KFold cross validation to train across 5 folds. The deck is shuffled to ensure the combinations are fresh. The model itself has an input layer, a hidden layer with more nodes, L2 regularizers, and a Dropout layer. The average of the train and test accuracys was .934 and .924, respectively.
Lastly, I ran a CNN model through the KFold Cross Validation across 5 folds. To start the CNN model, I define the convolutional base using a common pattern: a stack of Conv2D and MaxPooling2D layers. I then use the same Dense block as my first model, with the hidden layer with more nodes, L2 regularizers, and Dropout layer. The average of the train and test accuracys was .951 and .947, respectively.
Step 5: Regression Results
As we can see above, the CNN model has slightly better accuracy and loss than our standard neural network. However, the CNN model takes more than 50 minutes to run, so it does not seem justifiable to use model 2 over model 1, despite our model performing better by around 2% accuracy.
Training Data Results:
              precision    recall  f1-score   support

         0.0       0.98      0.89      0.93      3351
         1.0       0.76      0.96      0.85      1240

    accuracy                           0.91      4591
   macro avg       0.87      0.93      0.89      4591
weighted avg       0.92      0.91      0.91      4591
Holdout Data Results:
              precision    recall  f1-score   support

         0.0       0.99      0.89      0.94        85
         1.0       0.79      0.97      0.87        34

    accuracy                           0.92       119
   macro avg       0.89      0.93      0.90       119
weighted avg       0.93      0.92      0.92       119
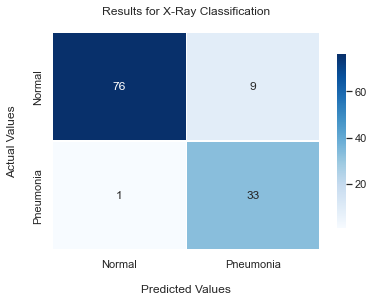
As we can see above, our recall metric related to class 1 is pretty high. This means that for our 34 patients that actually had pneumonia, only 1 of them was incorrectly classified as normal. This 97% recall rate appears to strengthen our capabilities of classification. While there is a small number of misclassification that is likely to cause patient readmission, this model will generally help solve our business problem of reducing the large amount of readmissions to hospitals due to pneumonia.
Next Steps
As we only have around 6,000 chest x-rays in our dataset, I would like to train new models with a larger scale of data to see if we are able to increase all of our metrics.