Step 1: Business Understanding
The purpose of this section is to define the business problem and understand the stakeholders for the work that I am performing. The Bureau of Meteorology is responsible for predicting weather patterns throughout the entire Australian region. According to their website, their forecast accuracy for rain varies much more than their forecasts for temperature and wind.
According to their analyses, they’ve underpredicted rainfall each year for the past five years. The goal is to create a classification model that allows the Bureau of Meteorology to improve their predictions of whether or not it will rain the next day. This will allow them to inform the public better so that citizens can prepare accordingly for the possibility of rain.
The stakeholders of this project are the Bureau of Meteorology and citizens of Australia.
The main purpose of this classification model is predictive, meaning that given charactaristics of rain data on a given day, the model should be able to predict whether it will rain the next day or not. My model is not meant to replace the Bureau of Meteorology’s current system of predicting rain for the region of Australia, however, it is meant serve as an input to strengthen their predictions and assumptions, and to reduce the risk of failing to predict that it will rain the next day.
Step 2: Data Understanding
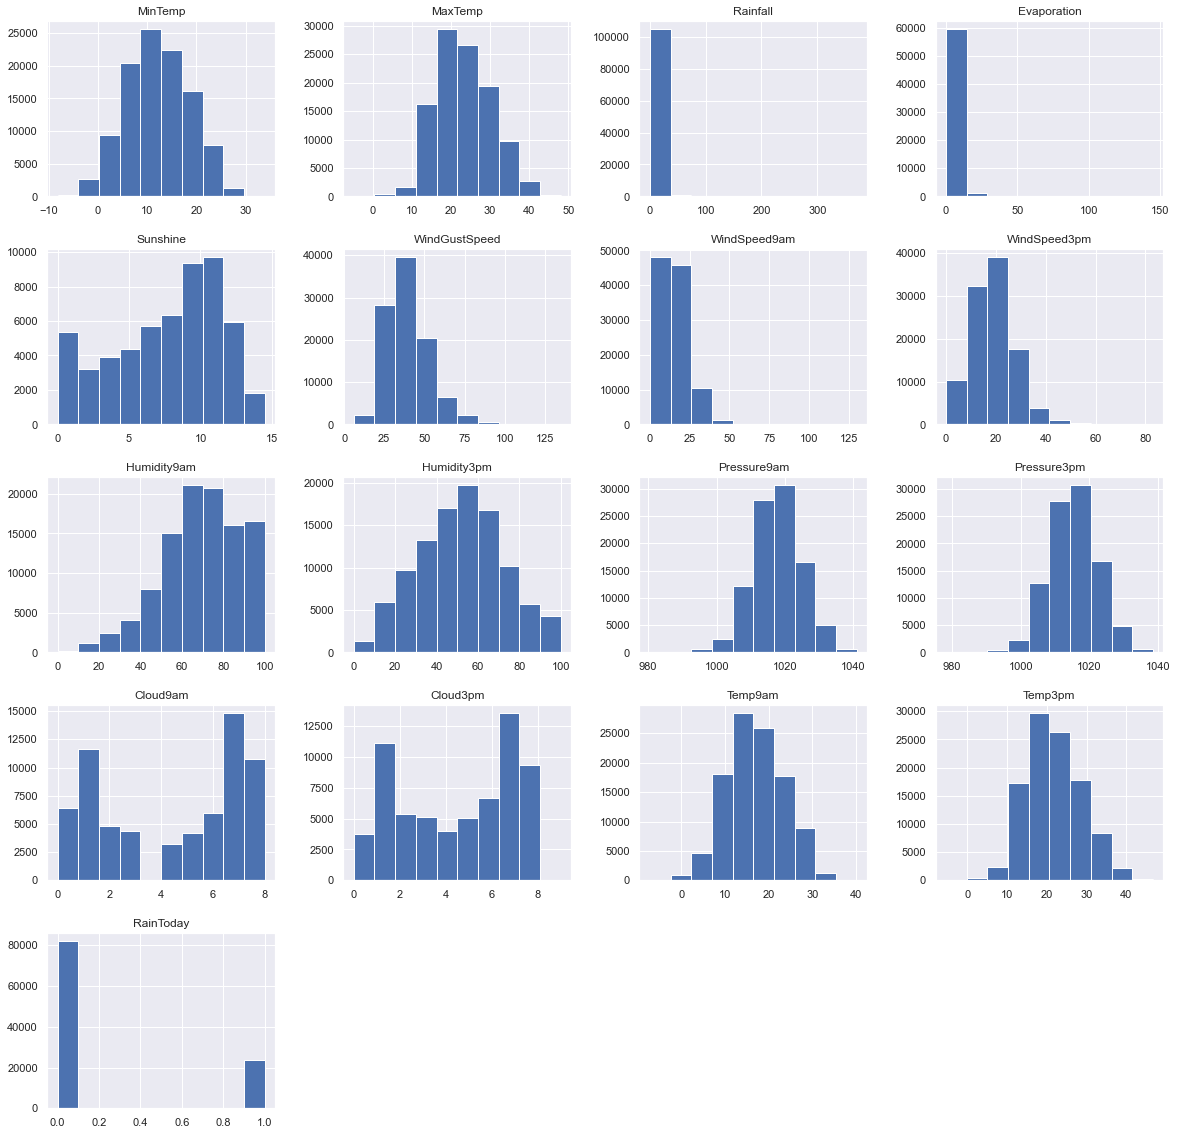
The columns in the data are below:
MinTemp: The minimum temperature in degrees celsius
MaxTemp: The maximum temperature in degrees celsius
Rainfall: The amount of rainfall recorded for the day in mm
Evaporation: The so-called Class A pan evaporation (mm) in the 24 hours to 9am
Sunshine: The number of hours of bright sunshine in the day.
WindGustDir: The direction of the strongest wind gust in the 24 hours to midnight
WindGustSpeed: The speed (km/h) of the strongest wind gust in the 24 hours to midnight
WindDir9am: Direction of the wind at 9am
WindDir3pm: Direction of the wind at 3pm
WindSpeed9am: Wind speed (km/hr) averaged over 10 minutes prior to 9am
WindSpeed3pm: Wind speed (km/hr) averaged over 10 minutes prior to 3pm
Humidity9am: Humidity (percent) at 9am
Humidity3pm: Humidity (percent) at 3pm
Pressure9am: Atmospheric pressure (hpa) reduced to mean sea level at 9am
Pressure3pm: Atmospheric pressure (hpa) reduced to mean sea level at 3pm
Cloud9am: Fraction of sky obscured by cloud at 9am. This is measured in “oktas”, which are a unit of eigths. It records how many eigths of the sky are obscured by cloud. A 0 measure indicates completely clear sky whilst an 8 indicates that it is completely overcast.
Cloud3pm: Fraction of sky obscured by cloud (in “oktas”: eighths) at 3pm. See Cload9am for a description of the values
Temp9am: Temperature (degrees C) at 9am
Temp3pm: Temperature (degrees C) at 3pm
RainToday: Boolean: 1 if precipitation (mm) in the 24 hours to 9am exceeds 1mm, otherwise 0
RainTomorrow: The amount of next day rain in mm. Used to create response variable RainTomorrow. A kind of measure of the “risk”.
After looking at the histograms of the columns, most seem to be normally distributed, except for cloud data.
Step 3: Data Preparation
Before modeling, I create numeric columns for our categorical fields using OneHotEncoding. I remove some of the columns to avoid the dummy trap. I then imputed nulls based on relationships and findings from the data. For Cloud Data, I use rain data and humidity to generate relationships. For sunshine data, I use rain data and the mean. The rest I imputed using the most frequent amount, as they seemed normally distributed.
Step 4: Modeling
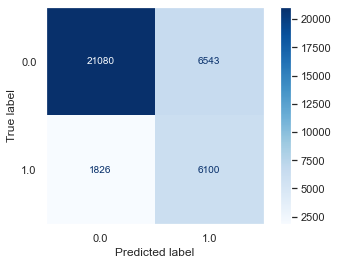
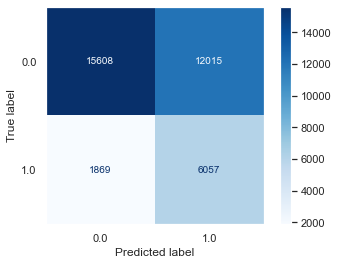
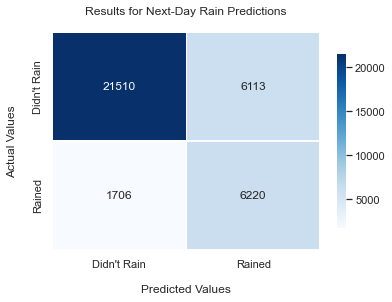
I ran different models using different parameters using Logistic Regression, kNN and Decision Trees. To select the best parameters, I used GridSearchCV. See the confusion matrices for the best models below. The metric I focus on the most will be recall, because if there are false negatives in my model, then it could rain on citizens who expected a dry day. As the Bureau of Meteorology has been underestimating rain over the past five years, we are trying to minimize false negatives as much as possible.
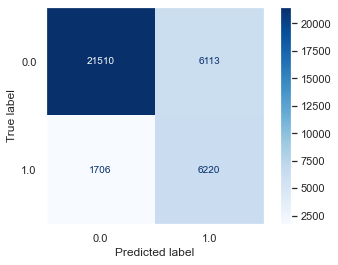
Logistic Regression
Baseline Model:
Best GridSearch Model:
k-Nearest Neighbors
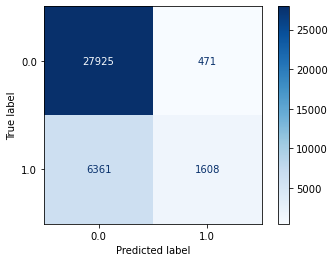
Decision Trees
Step 5: Regression Results
Below is the results of our models:
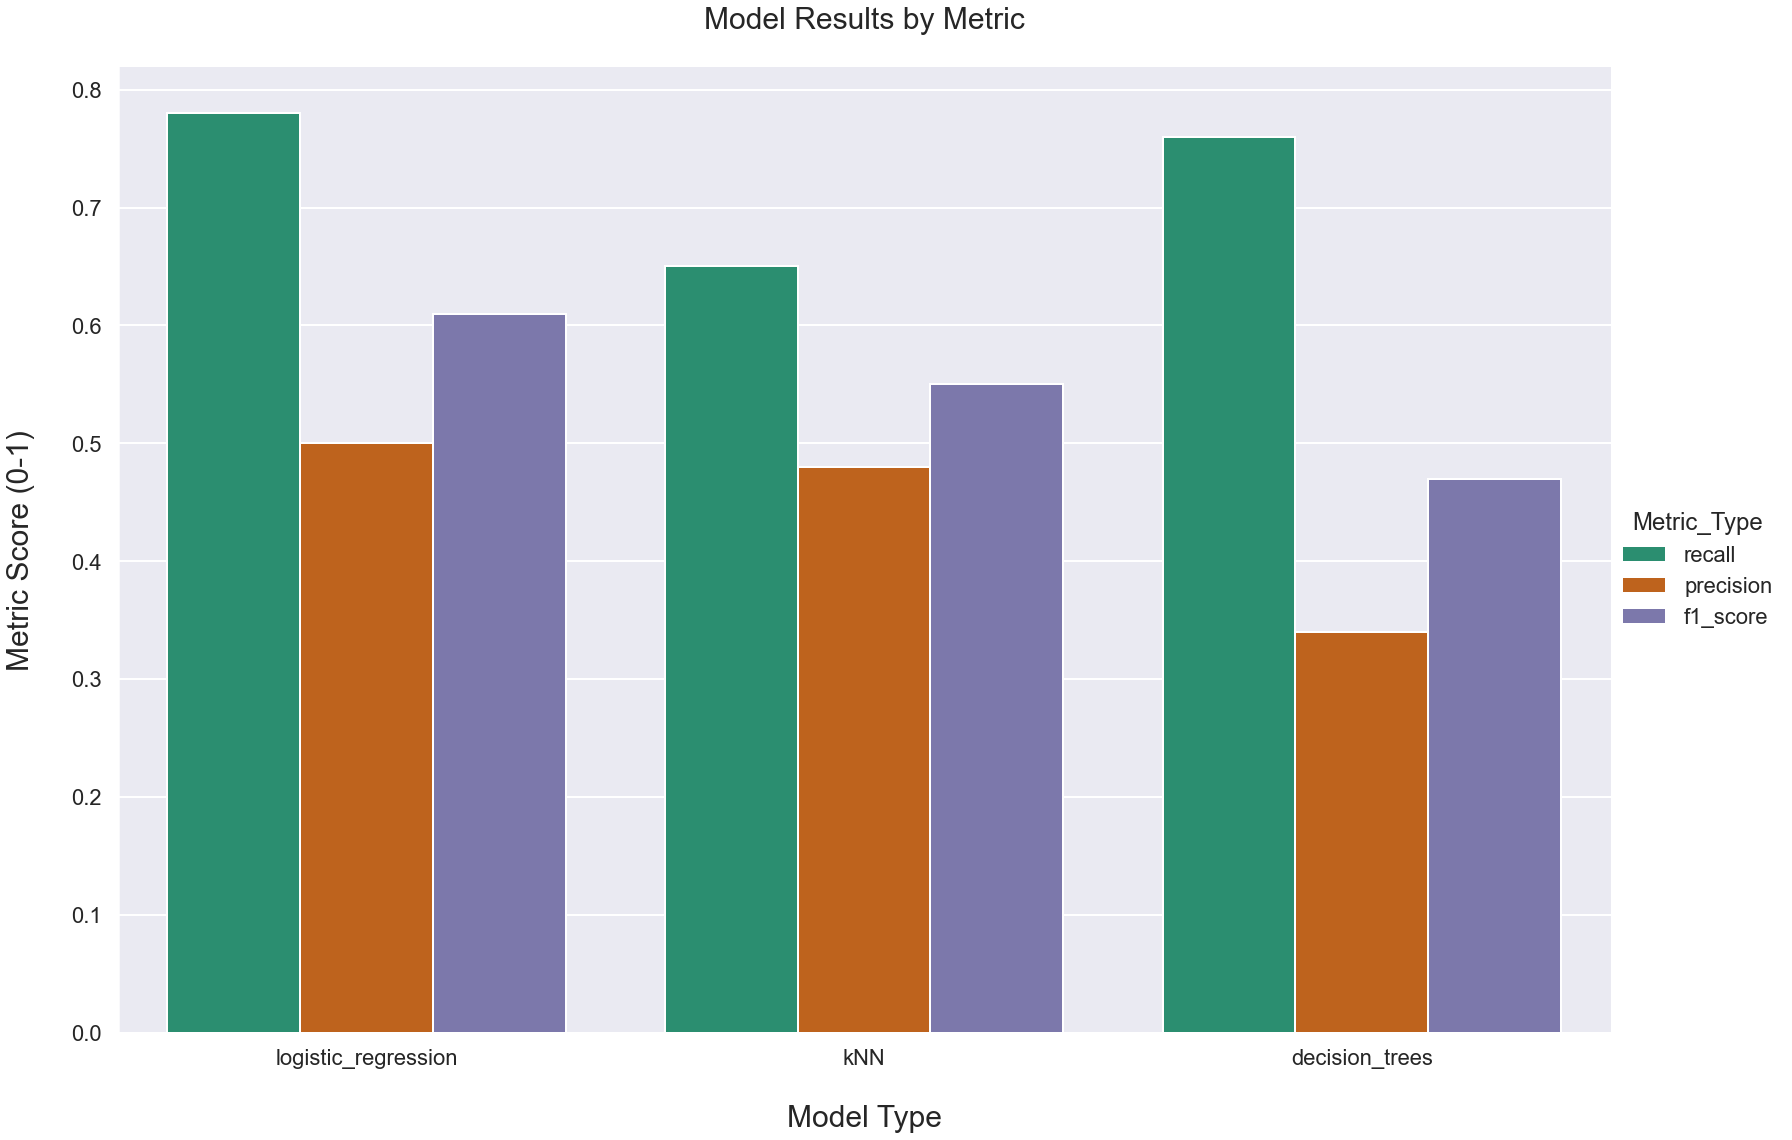
The logistic regression model was our best model, with a recall score of .77. The results are generated below:
Training Data Results:
               precision    recall  f1-score   support

         0.0       0.78      0.80      0.79     82693
         1.0       0.79      0.78      0.79     82693

    accuracy                           0.79    165386
   macro avg       0.79      0.79      0.79    165386
weighted avg       0.79      0.79      0.79    165386
Test Data Results:
               precision    recall  f1-score   support

         0.0       0.93      0.78      0.85     27623
         1.0       0.50      0.78      0.61      7926

    accuracy                           0.79     35549
   macro avg       0.72      0.78      0.73     35549
weighted avg       0.83      0.78      0.79     35549
Feature Importance:
Below is a graph of our statistically significant features generated by logit, logistic regression and decision trees.
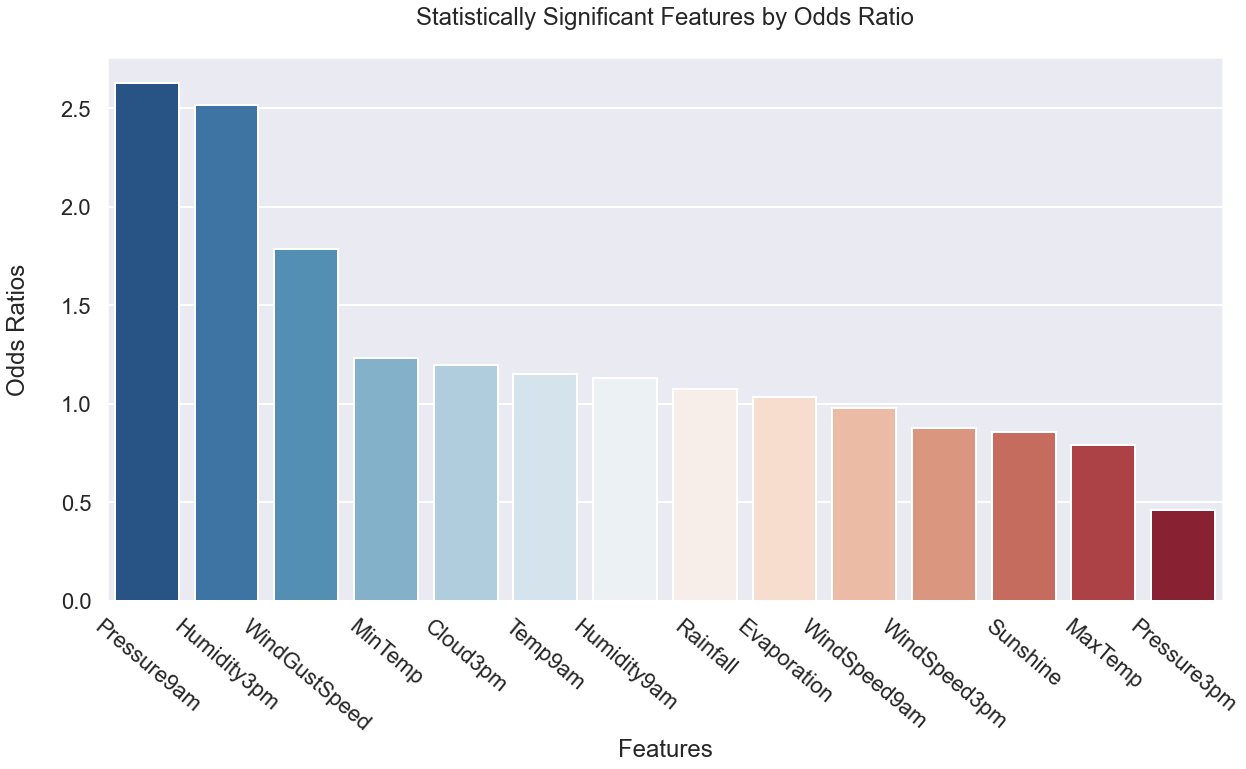
As we can see above, Pressure at 9am and Humidity are the most important positive features according to our models, at an odds ratio of 2.63 and 2.52, respectively. Next best is wind gust speed at an odds ratio of roughly 1.78. This means that:
-
An increase of 1 hectopascal of pressure at 9am is associated with a 163% increase in the odds that it will rain the next day.
-
An increase of 1 percentage point in humidity at 3pm is associated with a 152% increase in the odds that it will rain the next day.
-
An increase of 1 kilometer per hour for the day’s strongest wind speed is associated with a 78% increase in the odds that it will rain the next day.
After these three variables, our remaining variables that were statistically significant vary from odds ratios from 1.2 down to .5.
Note that the most important negative features are Sunshine, Max Temp, and Pressure 3pm at odds ratios, of .86, .79, and .46, respectively, meaning:
-
An increase of 1 hectopascal of pressure at 3pm is associated with a 54% decrease in the odds that it will rain the next day.
-
An increase of 1 degree (C) of the max temperature during a day is associated with a 21% decrease in the odds that it will rain the next day.
-
An increase of 1 hour of sunshine during a day is associated with a 14% decrease in the odds that it will rain the next day.
Next Steps
As our precision is a little low, it might be beneficial to test using different models in the future, like random forests. We could also obtain more data with different features to see if it improves the model.